


Online notes, resourses: algebra, calculus, differential equations, statistics
csotuyo@yzplane.com
The OPEN textbook LIBRARY: the most complete source of free textbooks in the world wide web !! (pdf download, again, for free). Algebra, Linear Algebra, Calculus, Statistics, Abstract Algebra, Number Theory etc ...
Paul's Online Math Notes http://tutorial.math.lamar.edu/
Professor Paul Dawkins website covers his classes: Algebra (Math 1314), Calculus I (Math 2413), Calculus II (Math 2414), Calculus III (Math 2415) and Differential Equations (Math 3401). Professor Dawkins teaches at Lamar University, Texas.
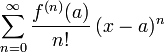
** By WolframMathWorld.com: A Taylor series is a series expansion of a function about a point. A one-dimensional Taylor series is an expansion of a real function f(x) about a point x=a is given by:
1. Summary of Convergence Tests for Series with examples, pdf.
2. Convergence tests for Series: flowchart, pdf.
Statistics:
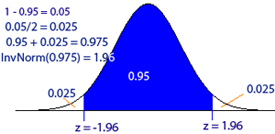
The normal distribution:
Mth120 - Statistics I at Elgin Community College
The University of Alabama in Huntsville: Random
Probability, Mathematical Statistics, Stochastic Processes
Content.Introductory Statistics, Vol 1: textbookequity.org
Introductory Statistics, Vol 2: textbookequity.org
Collaborative Statistics, pdf download, by Barbara Illowsky PhD.
Introduction to Probability, Dartmouth College: 1. Ebook; 2. Solutions.
1. Stat Trek, Teach yourself statistics: http://stattrek.com/
2. Summary of confidence interval and hypothesis testing formulae by Duquesne University Math Dept.
3. Online Statistics Education: An Interactive Multimedia Course of Study Developed by Rice University (Lead Developer), University of Houston Clear Lake, and Tufts University
4. University of Texas: Virtual Laboratories in Probability and Statistics
5. Statistics Tables, online: University of Central Florida
6. Statistics Formulas by Mario F. Triola Copyright 2010 Pearson Education.
7. Statistics Tables by Mario F. Triola Copyright 2010 Pearson Education.
*Complete set of formulas and tables, by Mario Triola*
+another set of stat formulas+
8. Student's t distribution table, pdf, by scholar.vt.edu
Also: Important Formulas card, from Essentails of Business Statistics by Bowermann & O'Connell.
Direct download here.9. F tables: There is an F table for each alpha (right tail). The rows represent denominator degrees of freedom and the columns represent numerator degrees of freedom.
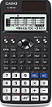
Most hypothesis testing problems avoid left tailed tests. Sometimes, however, the left F critical value is needed. If you have a calculator --like Casio fx 9750 or 9860, then go to Dist, F, InvF, enter 1-alpha or 1-alpha/2,-for one tailed or two tailed tests, respectively; and the degrees of freedoms: numerator(n:df), denominator (d:df). See right tail areas, by UCLA.10. Confidence Interval for One Variance:
Casio graphing calculator: Distributions, CHI, InvC. Area: alpha/2 and 1-alpha/2; df=n-1.
11. Confidence Interval for the Ratio of two Variances:
The confidence interval provides a range of likely values for the ratio between two population variances or standard deviations. If the confident interval contains one, we cannot conclude that the population’s variances differ. It is given by:
Finding F critical values:
Casio graphing calculator: Distributions, F, InvF: for F alpha/2, Right tail, enter the alpha/2, for Area; then the numerator df, followed by the denominator df. (Recall, the larger variance goes on the numerator).
For the left tail, enter the 1-alpha/2 value for area, and numerator df, denominator df.Note: images created online at codecogs/editor/latex/eqneditor.php
Understanding Public Opinion Survey
by MichiganSc.
Designing an Experiment, Power Analysis by Statsoft.com
"Performing power analysis and sample size estimation is an important aspect of experimental design, because without these calculations, sample size may be too high or too low. If sample size is too low, the experiment will lack the precision to provide reliable answers to the questions it is investigating. If sample size is too large, time and resources will be wasted, often for minimal gain. "
Java applets for power and sample size by statsoft.com
Power tables (Cohen, 1988) pdf.
Power analysis: Effect size formulas, by UCLA.
Power Analysis in R by Quick R, by DataCamp.Calculation of Beta (PWR=1-Beta), for a test on mean(population SD estaimated by large sample SD) sampling from normal population or when n is large --for a one sided test, replace z_alpha/2 by z_alpha:
Image created using codecogs.com latex equation editor.
Power analysis in R: http://www.statmethods.net/stats/power.html
Statistical Intervals. Tolerance intervals.
A tolerance interval is a statistical interval within which, with some confidence level, a specified proportion of a sampled population falls (source, Wikipedia).* You might want a tolerance interval by Mark J. Nelson
* Understanding Statistical Intervals: Part III - Tolerance Intervals by ProPharma Group
* Values of k for Two-Sided Intervals
Confidence Levels and Hypothesis testing:
**Summary of confidence interval and hypothesis testing formulae** by Duquesne University Math Dept.
ANOVA table:
One-way ANOVA Source of Variation SS df MS F Between Groups SSB k-1 MSB=SSB/df F=MSB/MSW Within Groups SSW n-k MSW=SSW/df Total SST=SSB+SSW n-1 SSB(between) =SST(treatments)
SSW (within)= SSE (residual errors)
Total sum of squares=Treatments sums of squares + sum of squares of the residual error.
Two way ANOVA Source of Variation SS df MS F Factor A SSA a-1 MSA=SSA/df MSA/MSE factor B (blocks) SSB b-1 MSB=SSB/df MSB/MSE Error SSE (a-1)(b-1) MSE=SSE/df Total SST=SSA+SSB+SSE n-1
SSB, sum of squares due to blocks: the sum of the squared differences between block means and the overall mean, multiplied by k, the number of treatments.Critical Values for the Tukey Q Test, alpha = .05 click here
ANOVA regression: df SS MS F Regression 1 SSR MSR=SSR/df MSR/MSE Residual n-2 SSE MSE=SSE/df Total n-1 SST=SSR+SSE Regression df: number indep vars (IP).
Residual df: number of data points(observations)-num ip-1. Simple linnear reg df=n-2; multiple linear regression: n-ip-1.
The R Project for Statistical Computing
https://r-project.org
Datasets Available in R - GitHub PagesCollege of the Redwoods, using R in Statistics.
Probability Distributions in R (Stat 5101, Geyer)
Columbia Univ: Statistics, R Notes.
Basic Statistical Analysis Using R:
by T. Heeren & J.Milton,
Boston University.Quick R by statmethods.net
MarinStatlectures.com: R tutorials
Table of Useful R commands,
Calvin College.Probability Distributions in R,
University of Minnessota.College of Staten Island: Using R for Introductory Statistics:
John Verzani:
link or download it here.
SimpleR is a previous version
of John Verzani's ebook.Logistic Regression in R: 1, 2
Logistic regression and glm (pdf)